
Blackmont
Blackmont's Analysis of the Sectors of the S&P 500
This section illustrates the heatmap percentile rankings of various financial and performance indicators for multiple companies (tickers) within a specific sector of the S&P 500. Each color represents a different percentile (1, 5, 25, 50, 75, 95 and 99) for metrics such as short ratio, dividend yield, market cap, and others, allowing a quick comparison of company performance across indicators.
Analyzing the Real Estate Sector: Insights from S&P 500 Indicators
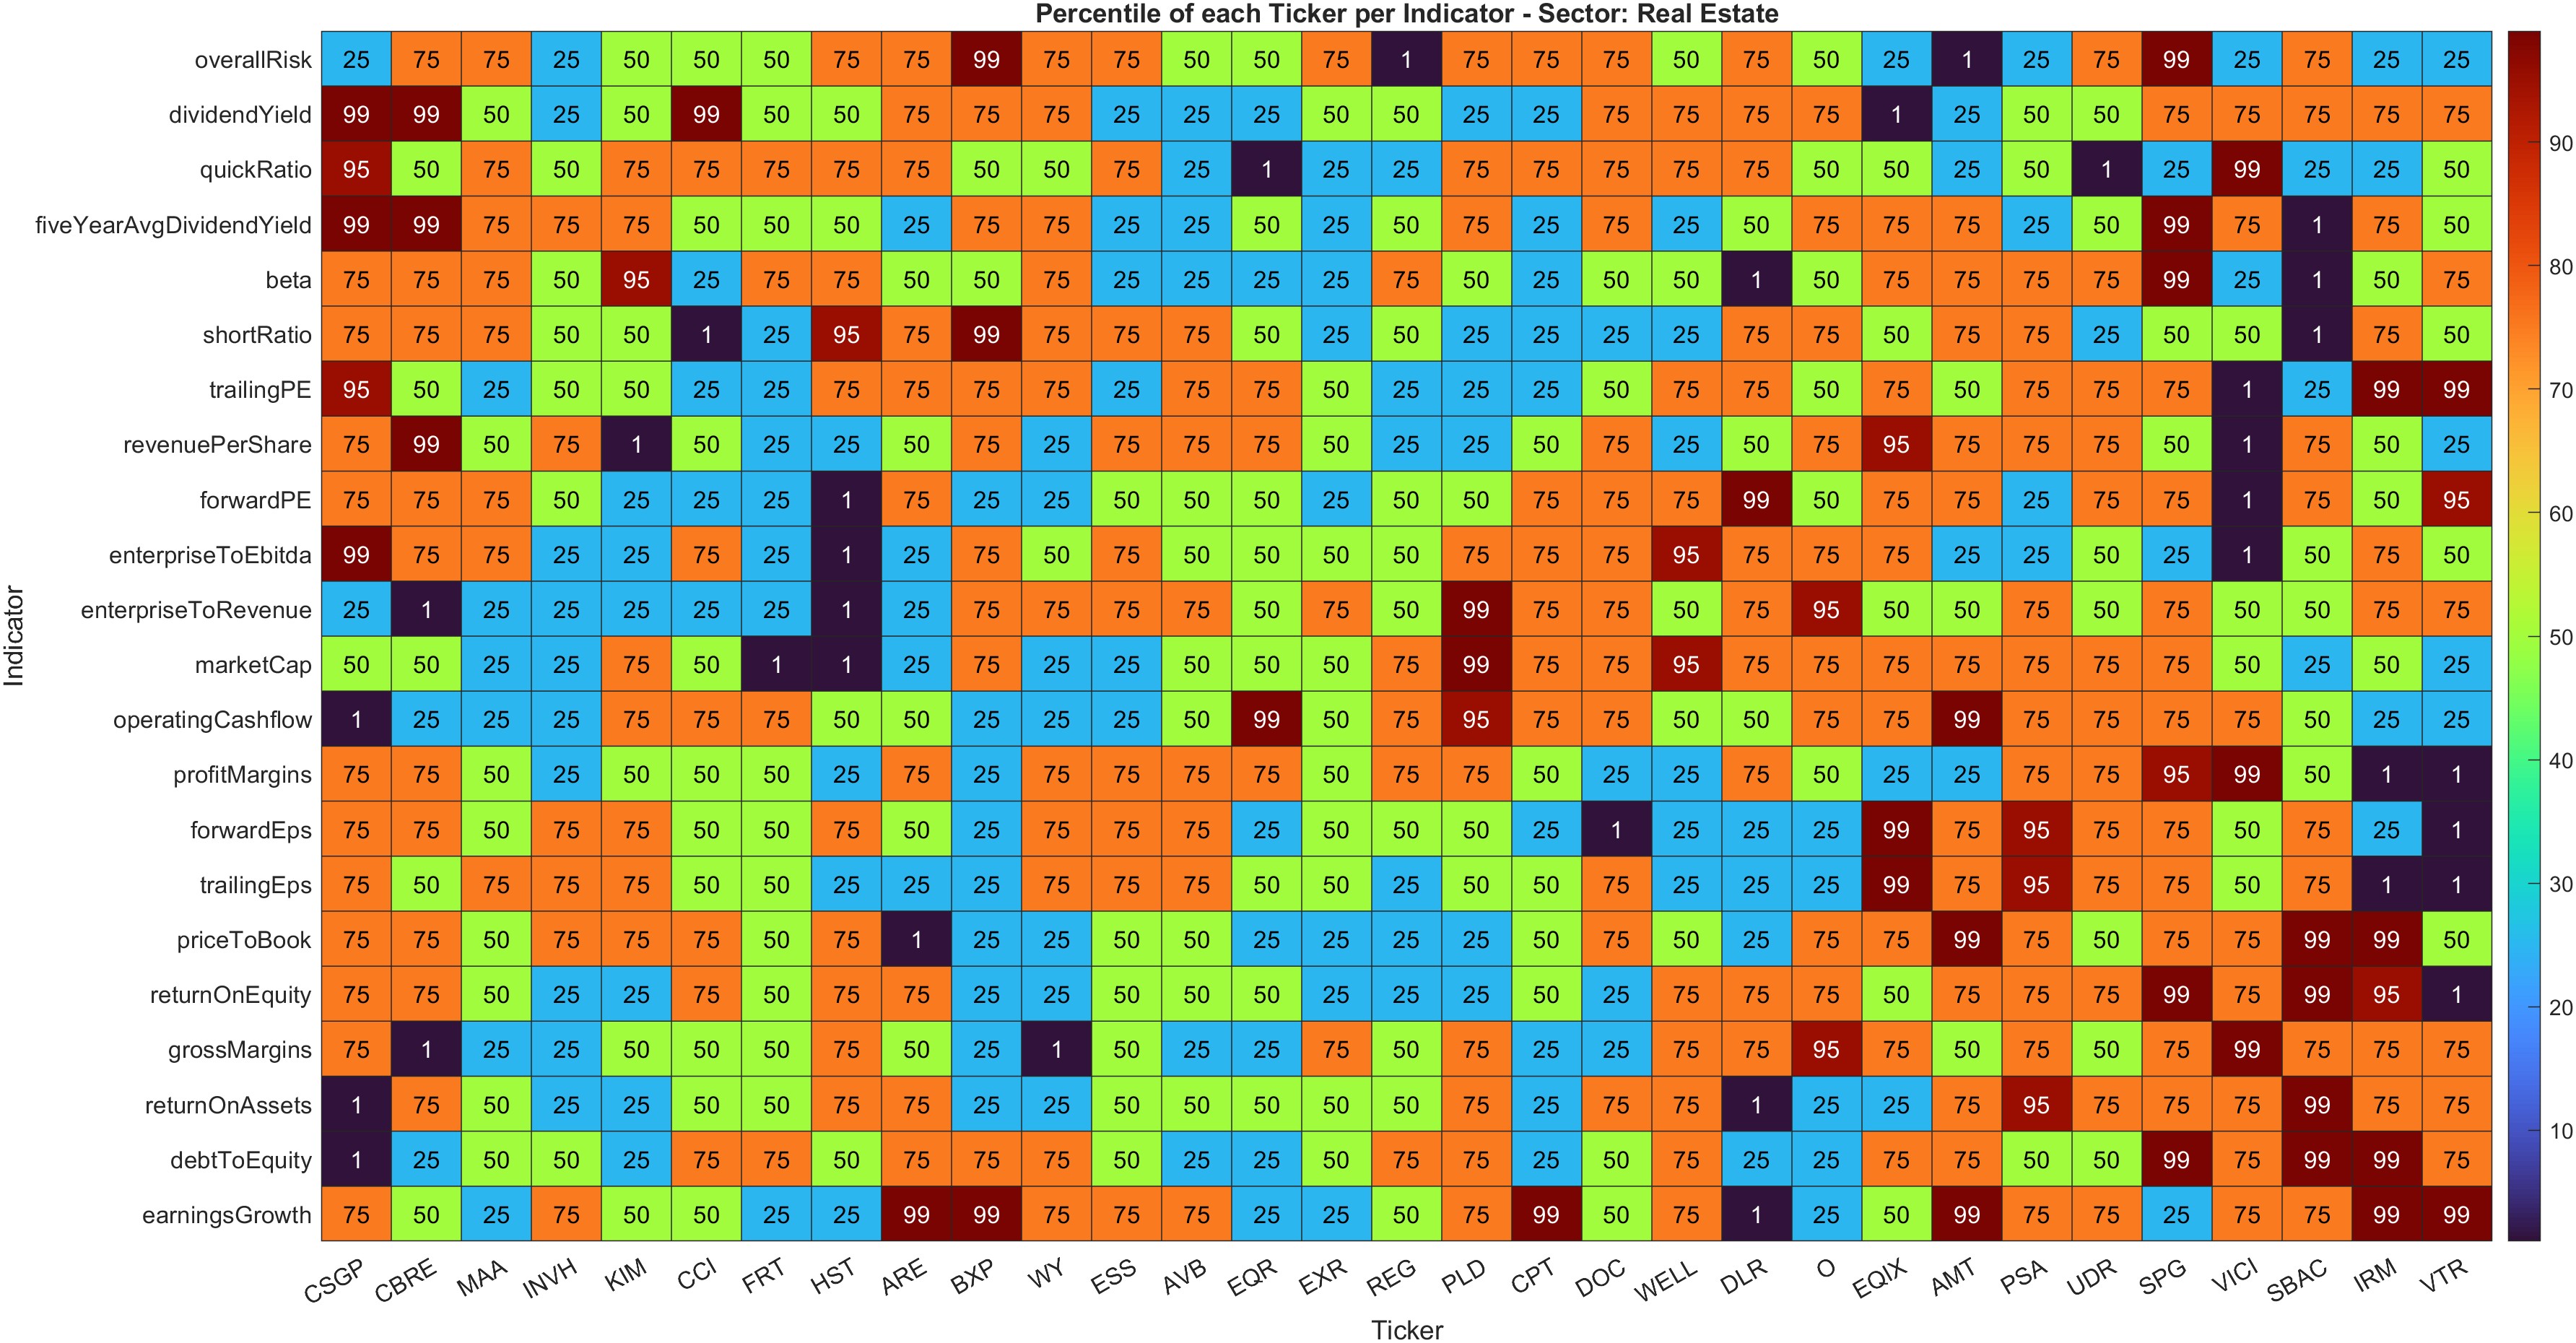
The Real Estate sector is a significant component of the S&P 500, characterized by its equity, stability, and crucial role in the economy. As investors seek reliable insights, understanding key financial indicators like earnings growth, dividend yield, beta, and others becomes essential. These metrics not only reveal the performance of individual companies but also illustrate broader trends within the sector.
Key Observations
Upon analyzing the heatmap of S&P 500 Real Estate tickers across various financial indicators, several notable patterns emerge:
- Dividend Yield: Companies such as Realty Income Corp (O) stand out with high percentiles in dividend yield, reflecting their commitment to returning value to shareholders. In contrast, firms such as Prologis (PLD) show lower yields, likely due to higher reinvestment strategies.
- Beta Analysis: A company like American Tower (AMT) exhibits a moderate beta, suggesting it has a steadier price movement compared to the market, indicating lower volatility.
- Debt Metrics: Companies such as Public Storage (PSA) show strong debt-to-equity ratios, indicating robust financial health, whereas others like Healthpeak Properties (PEAK) show concerning low rankings in this indicator.
Leaders and Laggards
In reviewing the performance of specific companies within the sector, a clear division between leaders and laggards becomes evident:
- Leaders: Equinix (EQIX) and Prologis (PLD) rank highly across multiple indicators, earning high marks for revenue per share and operating cash flow. Their ability to generate consistent income stems from strategic locations and premium property holdings.
- Laggards: Companies like Regional Management Corp (RM) display lower scores across key indicators, particularly in net margins and earnings growth. The challenges it faces stem from increased operational costs and market saturation.
- General Trends: The tendency for many companies to prioritize dividend returns reflects a cautious approach, especially in an uncertain economic climate. Investors often look for stable returns, favoring established firms.
Sector-wide Analysis
The Real Estate sector exhibits notable trends related to its cyclical nature. During periods of economic uncertainty, metrics such as operating cash flow and profit margins take precedence. Recognizing this, firms like Welltower (WELL), which focus on healthcare real estate, have positioned themselves as resilient players.
Additionally, the heatmap reveals a clear inverse relationship between enterprise-to-revenue ratios and market capitalization. Larger firms, typically capitalized at higher rates, often rely on diversified income streams, while smaller firms exhibit higher ratios due to concentrated revenues.
Conclusion
As the Real Estate sector adapts to the evolving economic landscape, opportunities and risks continue to emerge. Companies demonstrating strong metrics in dividend yield, return on equity, and earnings growth present attractive investment prospects. However, potential investors must remain aware of the sectors with high debt levels and low profitability margins.
In summary, understanding the performance indicators laid out in this analysis provides valuable insights into the current state of the Real Estate sector within the S&P 500, guiding strategic investment decisions. The future remains promising for companies willing to innovate and adapt to changing market conditions.